At Wattson Blue, we believe in the concept of KISS (keep it simple, stupid) – a recovery and training plan should not be that complicated. Keep it simple, do the basics, and you should see benefits long term.
The best way for each individual to achieve this is to have some understanding of the data and metrics being shown in Wattson Blue. Don’t worry, the concepts may seem complicated, but trust us, they are rather simple once you learn a few basic ideas.
In order to understand how much stress your body goes through during training, Wattson Blue gives a training load score to each training session and uses these to calculate some important metrics to help you monitor your well-being and performance, particularly form, fatigue and fitness. This article provides a concise summary of what these values mean and how to interpret them.
We also recommend having a look at many other interesting and informative articles elsewhere on the internet written about how these values are often calculated, and what they mean. As always, the more you know, the better you can make decisions about your training and recovery.
Training Load (TSS)
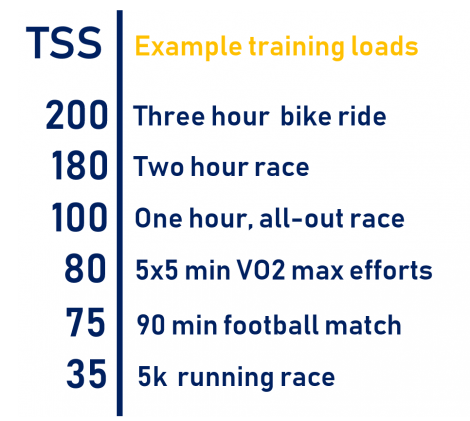
For each activity, Wattson Blue calculates a Training load (or Training Stress Score/TSS – copyright of Training Peaks) using power, heart rate, pace, or rate of perceived exertion/RPE (i.e. how challenging you found that session). Some examples of possible training load values are outlined in the table. A load of 100 would equate to an all-out maximal one-hour effort. As such, a load of 200 should not be possible for a two-hour race since you could not continue at the same rate for another hour (If you do end up with such a training load, your functional threshold values are most likely wrong, and should be re-adjusted).
(The calculation of the training load requires your personal threshold effort heart rate and power data which can be set in the Fitness Settings page of the app. Any questions about this, drop us a line at support@wattson.blue)
Intensity Factor
Similarly, Wattson Blue associates an intensity factor to each activity using Heart Rate, Power, Pace, and/or RPE. Intensity Factor (or IF) is a measure of how hard a session was, irrespective of the session duration. An all-out maximal one-hour effort is defined to have an intensity factor of 1.0. Note by ‘definition’ it should not be possible to have an IF of 1.0 or higher for a session longer than one hour.
IF is calculated according to your current threshold fitness values (FTP/FTHR). A 5km running race might have an IF of 1.05 whereas a 3 hour gentle club ride might have an IF of 0.55.
IF is a useful metric to manage your training intensity over time. As an endurance athlete, most of your training should be at lower intensity factors of below 0.7 and some high intensity interval sessions.
Training Load and IF are highly related to each other, such that:
Training Load = IF * IF * Time * 100
Fitness (CTL) and Fatigue (ATL)
The cumulative training loads for activities over several days are used to calculate two important variables:
- Fitness (Chronic Training Load/CTL): in simple terms, a rolling 6-week average of your activities’ training loads
- Fatigue (Acute Training Load/ATL): a rolling 1-week average of your activities’ training loads.
The averaging gives higher weighting to recent values. The general idea is that you accumulate ‘fitness’ by exercising, but your more recent exercise causes you ‘fatigue’.
Unlike, what the name suggests, higher CTL or fitness does not mean better performance, so as athletes we should avoid chasing these numbers, but instead use the as a guide to see how much stress we have been putting our body through recently.
What is Form (TSB) and how do I interpret it?
Form (Training Stress Balance/TSB) is calculated as CTL – ATL. In very simple terms, if you have negative TSB you may be stressing your body out more than usual because your ATL (recent load) is higher than your CTL (longer term load). You are training your body to take on more load.
So, negative TSB implies that your long-term CTL is increasing.
On the other hand, positive TSB means you have been training less than usual recently. It generally means you should be feeling fresh. You might often look for positive Form or small negative form just before an event, or every few weeks when you are periodising your training.
So, you might look for TSB above -10 when tapering for a race or during recovery weeks, every 3-5 weeks. The graphic outlines a summary of how you may interpret different TSB values.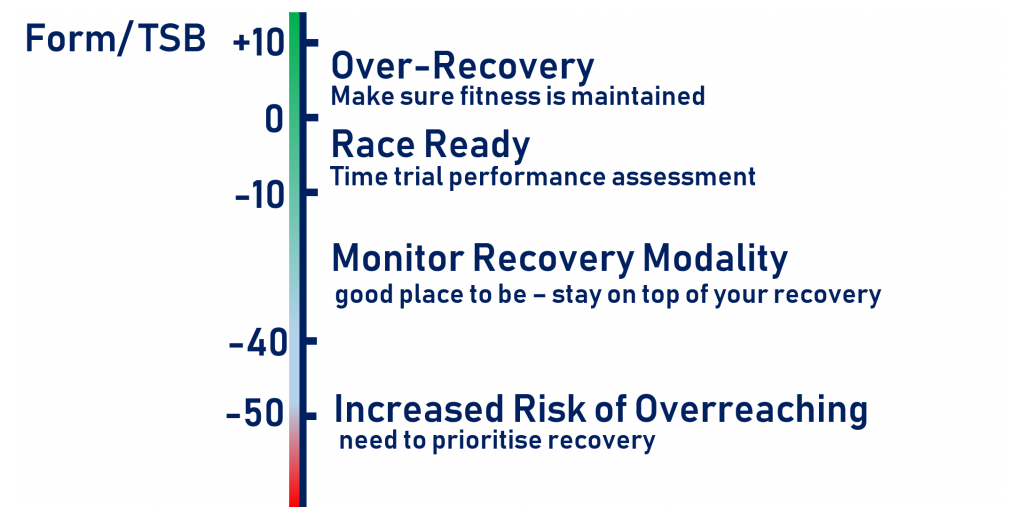
Most athletes might struggle with TSB below -40 or -50 for too many weeks. Generally, unless you know what you are doing, avoid going below -20 for too many consecutive weeks. At the periods of very negative form, it’s important to stay on top of your recovery, sleep and nutrition. Wattson Blue is ideal for that, as it tracks your key metrics.
What are training zones?
Training zones are designed to help monitor and mange the training intensity of different activities. Although, TSS (discussed above) attempts to combine training intensity and volume into one number, a lot of studies of top athletes suggest that not all TSSs are equal, and you need to spend time in the ‘right’ training zones to maximise long-term training response.
The most accurate way to calculate your training zones is in a lab, and that’s what a lot of Wattson Blue athletes do. However you may also estimate your current training zones.
Scientific literature has different estimates for calculating HR training zones. In Wattson Blue, we take the following percentages of maximum heart rate (MHR) as estimates for your training zones:
- Z1: 55% MHR
- Z2: 72% MHR
- Z3: 80% MHR
- Z4: 87% MHR
- Z5: 93% MHR
You can customise these if you wish in Wattson Blue.
For cycling and rowing, we use the following estimates using your functional threshold power:
- Z1: 0
- Z2: 55% FTP
- Z3: 76% FTP
- Z4: 90% FTP
- Z5: 105% FTP,</li>
- Z6: 120% FTP (cycling only)
- Z7: 150% FTP (cycling only)
And for running, using functional threshold pace:
- Z1: –
- Z2: 129% FTP
- Z3: 113% FTP
- Z4: 105% FTP
- Z5: 100% FTP
- Z6: 96% FTP
- Z7: 90% FTP
What is Ramp Rate?
Ramp rate is how quickly your fitness or CTL increases over time. Too high a ramp rate, and you risk burnout and injuries, and too low, and you won’t improve sufficiently. Though also realise that getting fitter is not just about increasing your CTL. What ‘ramp rate’ an athlete can handle depends on their past experience, their current stress levels, their recovery modalities, their resilience and much more.
How should you manage your ramp rate and TSB?
An average ramp rate of 2-8 per week may be common depending on your past background. Imagine if you have a fitness of 40 at the start of the season, even with an average ramp rate of 3 per week, you will have a fitness of 118 in 6 months, which is extremely respectable for a lot of athletes.
You shouldn’t try and have too high a ramp rate as it can lead to injuries and burnout. As Alberto Salazar, a top running coach, and Alan Couzen, another top triathlon coach, say ‘you have to be patient’. Give yourself time to make long-term improvements.
How should I manage my weekly training load?
There are many articles written about this, but here is a very brief example of how you might want to manage your training.
In very very simple terms, you may want to have 3 ‘loading’ weeks, where each week you try and have higher than ‘average’ training load, and one ‘recovery’ week, where you might have a gentler week to allow your body to make all those important gains and improvements.
Remember, you don’t improve during training, you improve during recovery; be it overnight sleep, resting during the day, or during recovery days and weeks.
If you are aiming for an average Ramp Rate of 3 per week, you might want to average +5 for the first 3 weeks, to get you an increase of around + 15 and then an easier week with a drop of fitness of -3 or 4 to get you to an average of 3 per week for those 4 weeks.
We must highlight again: your body improves during the periods of recovery, so make sure you give your body time to recovery. Consistently stressing the body out without sufficient recovery could lead to stagnation, burnout and injuries
How should I manage training intensity and time in different training zones?
At Wattson Blue, we are a big fan of polarised training. The idea of polarised training has been developed after studies of top endurance athletes (e.g. see http://sportscience.sportsci.org/2009/ss.htm). In very simple terms, If you breakdown training intensity into three levels, it’s been observed that top endurance athletes spend 80% of their sessions doing low intensity training (think Z1 and Z2) and 20% high intensity (think top of Z4 and Z5) and very little in that middle intensity (Most of Z3 and bottom of Z4).
The idea of the low intensity sessions are that they keep the stress on the body low while still developing the changes required in the muscular level. This then allows you to go hard in those 20% of the sessions for maximum benefit.
As amateur athletes you want to avoid ‘going hard’ all the time; generally going hard all the time means that your hard sessions will be too easy and your easy sessions will be too hard. This will create unnecessary fatigue in your body, without stressing your body enough, which will be detrimental to your long term improvements.
Fitness/CTL at competition time
A word of warning. Despite the fact that it is called ‘Fitness’, you generally don’t want your highest Fitness on your race day, but maybe 2-3 weeks before the actual competition. Generally your ‘Fitness’ peak will come with some fatigue too – so for your main races/targets you are actually looking for a slight drop in Fitness to make sure you are fresh on race day.
Finally, and a very big kudos
There is so much information online about these concepts. As always, we recommend reading more about the concepts we are introducing here. The more you know, the better decisions you can generally make!
Original credit for training load, TSS, or Training Stress Score (Trademark of Training Peaks) goes to Andrew Coggan, who built it off some of the heart rate based models by Banister in 80’s and 90’s. You can read more about all of this on Training Peaks website here.